
Play the video to see a demo of the instructions below.
CloudBank Usage Reports
CloudBank users can see their current account balances and review billing reports in the CloudBank portal, or explore accounting and security monitoring in more detail using the Kion cloud governance platform. PIs, Co-PI, and fund mangers also receive automated emails each time their project utilizes a 10% increment of its funds, until 80% when reports of available resources are emailed daily.
AWS: billing is finalized for the previous month on the 10th of each month; estimates are updated 1-3 times a day based on current burn rates.
Azure: researchers using subscriptions funded by Azure credits, note that spend data is not visible through the Azure portal. You can view usage details within the CloudBank portal. Please see our community article, How do you view credit spend in Azure?.
About Kion
In addition to the account summary reporting via the CloudBank portal and email notifications, CloudBank offers access to the Kion Cloud Governance Platform, which provides multi-cloud cost and security monitoring. Kion helps researchers gain visibility, provides optimization and cost-saving opportunities, and offers tools to control and manage cloud consumption. If you have used Nutanix Beam in the past, the concepts below map roughly onto what you're used to, but the navigation and terminology have changed:
- Organizational Unit (OU): Your CloudBank fund is mapped to an OU in Kion. This is the container that ties your award to its cloud spend.
- Project: Each OU will contain a similarly named project. The billing accounts tied to your award live on the project, under the "Accounts and Scopes" tab.
- Organization Chart: You can skip this view entirely and go directly to your Project.
Use Kion
1. Login to Kion
Click the button below:
Login to Kion
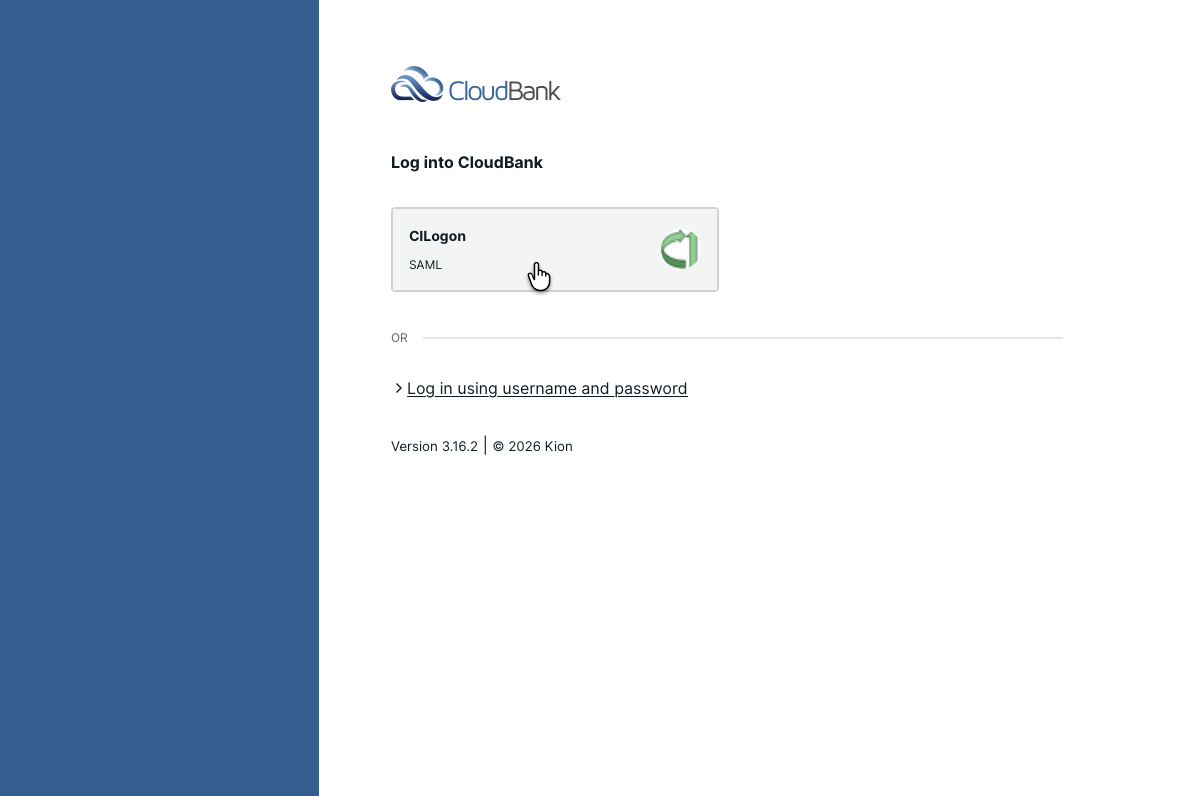
Then click the CILogon button to log in with your institutional credentials
2. Set default Kion dashboard (first login only)
Once logged in, you will be directed to the default dashboard homepage as shown below.
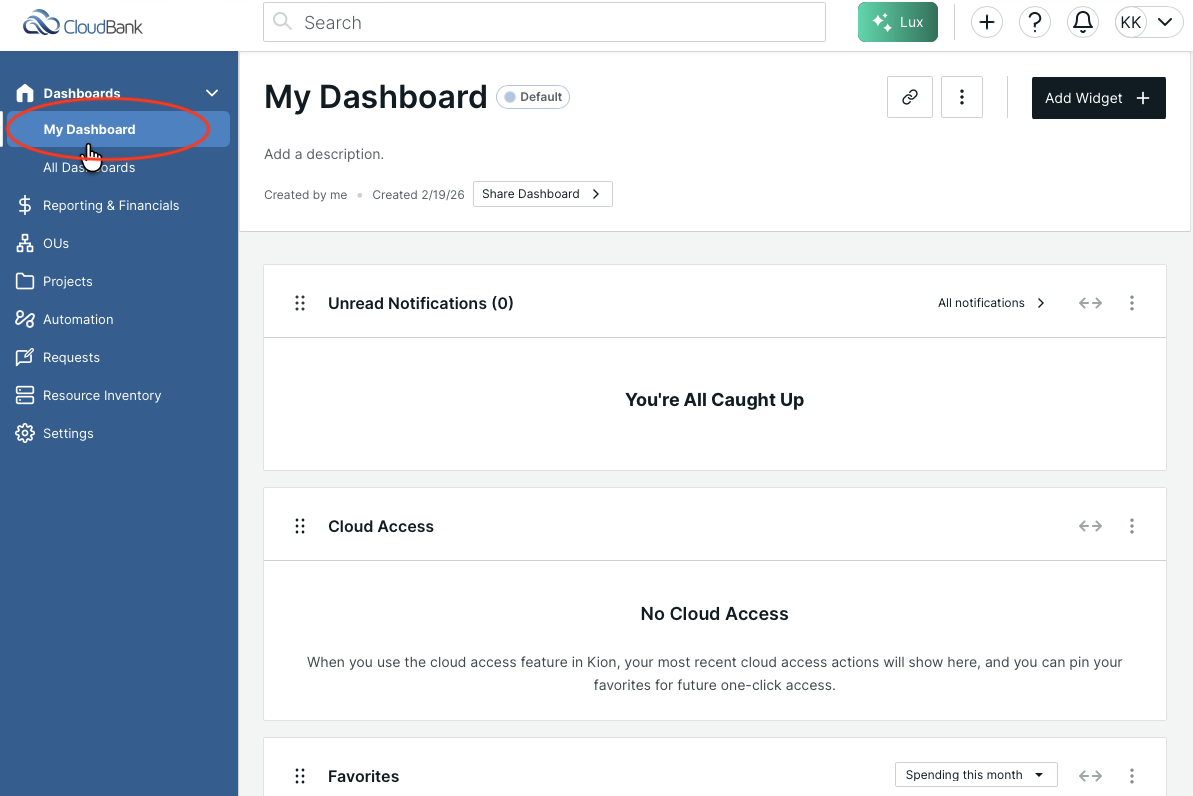
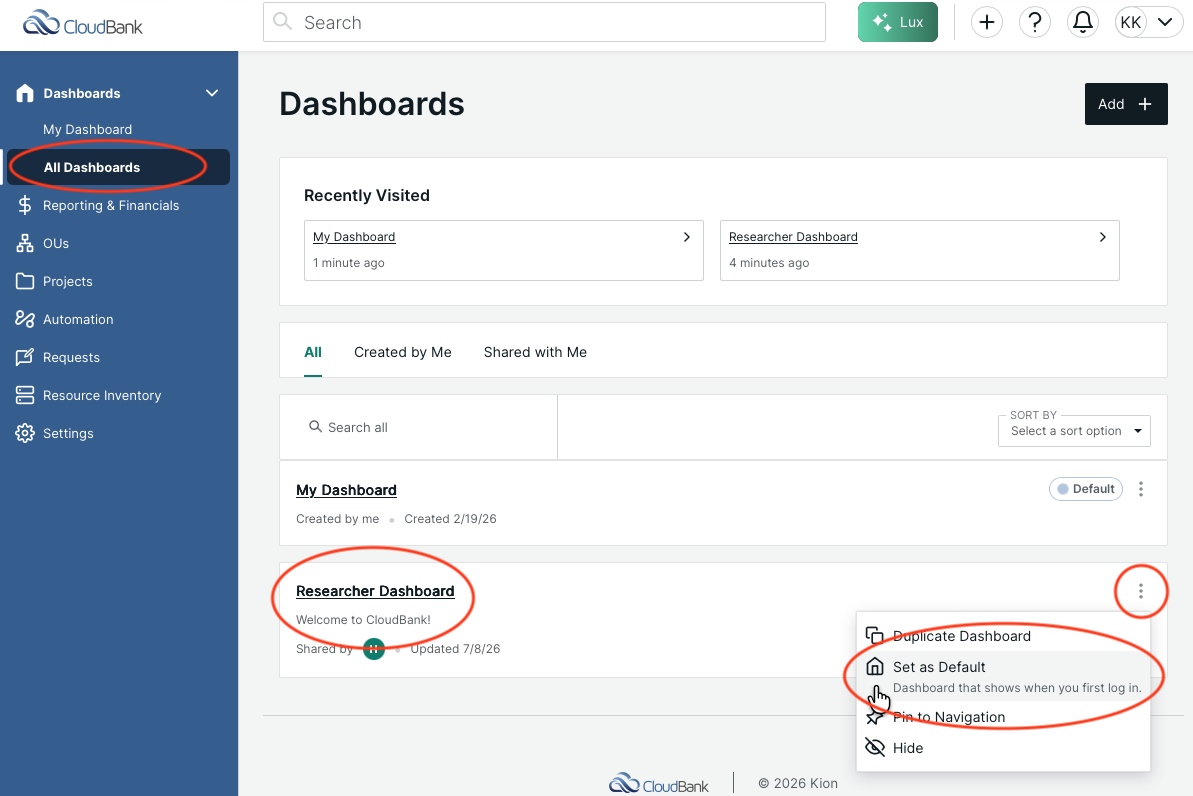
CloudBank has specially curated a "Researcher Dashboard," which can be found under "All Dashboards," to replace the default Kion dashboard. We highly recommend users set the "Researcher Dashboard" as their default upon first login.
Click on "All Dashboards" in the left navigation, then click the three dots to the far right of "Researcher Dashboard", and finally click "Set as Default":
3. Check Fund Budget Status
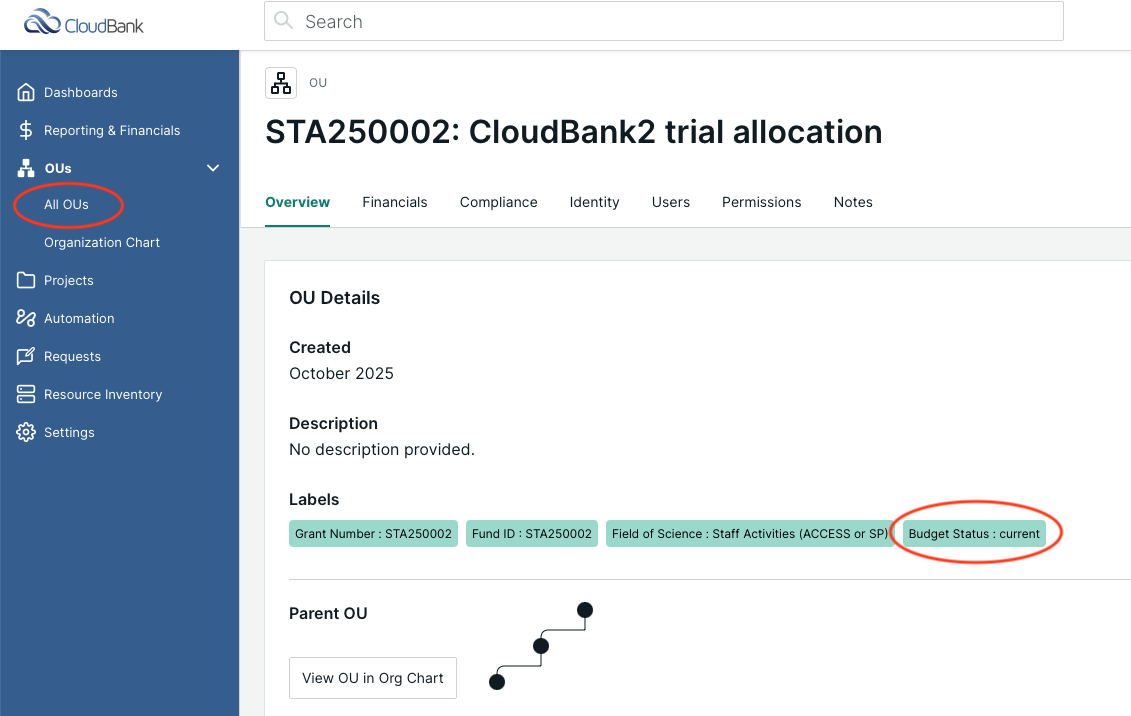
The equivalent of your CloudBank fund or allocation is shown in Kion as an "Organizational Unit (OU)". You'll have one OU for your allocation that you can view by clicking on the OU name after selecting "All OUs" from the left navigation.
Each OU is tagged with descriptive labels. The "Budget Status" label will tell you whether your CloudBank portal data is considered "current" or has been migrated into Kion and is complete and accurate. CloudBank added this label while migrating portal accounts to Kion (it's a new platform for CloudBank in 2026). If you notice that your budget is "not current", we're still working on migrating your account. However, if you send email to help@cloudbank.org requesting that your budget be updated, we will prioritize your request.
4. Explore Spend Reports
In addition to the dashboard view, each project has a "Financials" tab that can also be used for spend reporting. From the Financials tab, you can toggle between:
- Project Spending: similar to the dashboard view
- Budgets: active budget (with its date range) and spend-to-date against that budget
- Monthly Spending: table values of spend
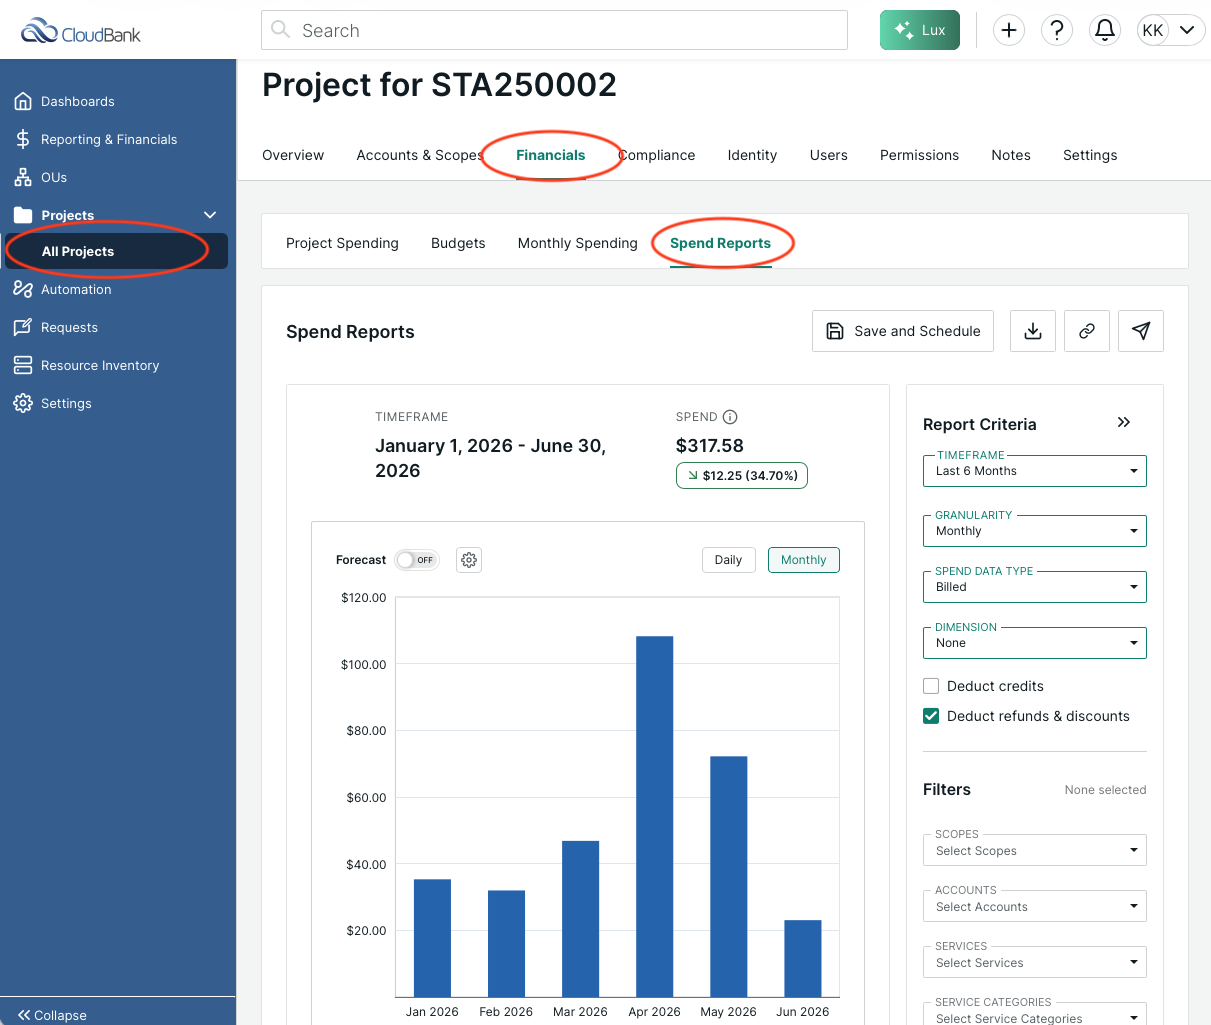
- Spend Reports: graph with filtering criteria for billing accounts, services, regions, and more, plus an adjustable time frame
We recommend using Spend Reports for the most granular view of spend, since it lets you filter down to specific services, accounts, and regions.
To see spend for your project, click on "Projects" in the left navigation. This shows a top-level view of all your projects. Click on your project name, select the "Financials" tab, and then select the "Spend Reports" tab:
-
Date range defaults: all date range fields default to "This Calendar Year"
- when viewing "Project Spending", it may be useful to switch to the "Lifetime" view, since it shows total spend since the award began rather than resetting at the calendar year boundary
- some items like Spend Reports do not have a "Lifetime" option
-
"Last" vs "This": this terminology shows up throughout date ranges
- "Last" (e.g., Last Month) does not include the current, in-progress period
- "This" (e.g., This Month) does include the current period's spend so far, updated as it progresses
5. Explore Spend Dimensions
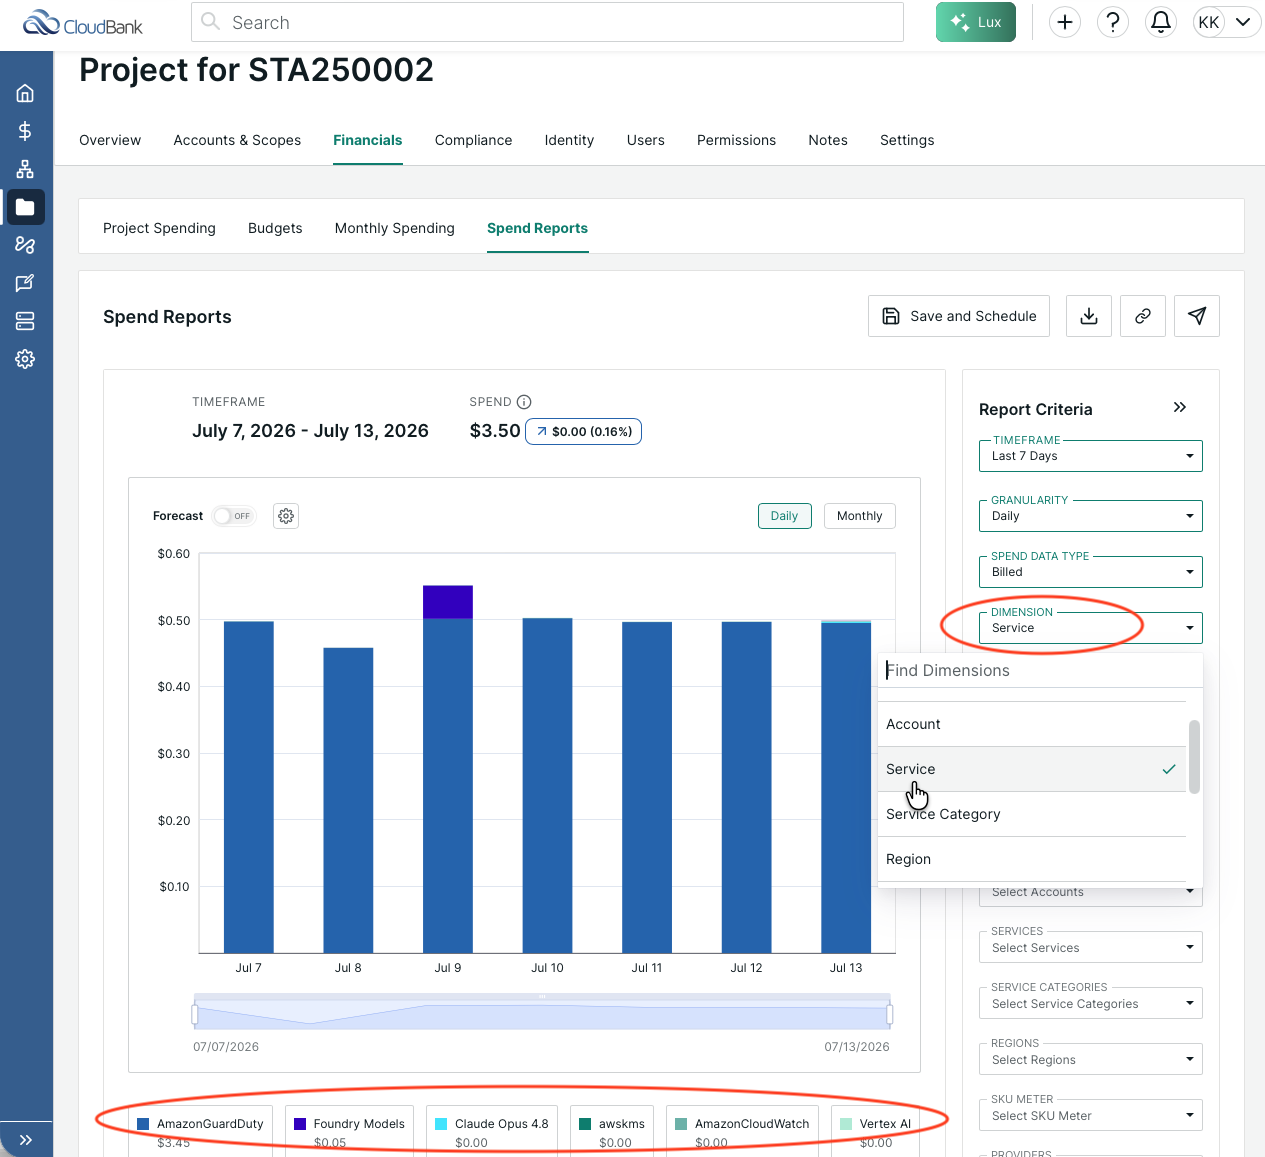
Dimensions control how a spend report groups your costs. The same total spend can be broken down by different dimensions. For example, "Service" groups spend by cloud product (EC2, S3, etc.). Use it to see which services are driving your costs:
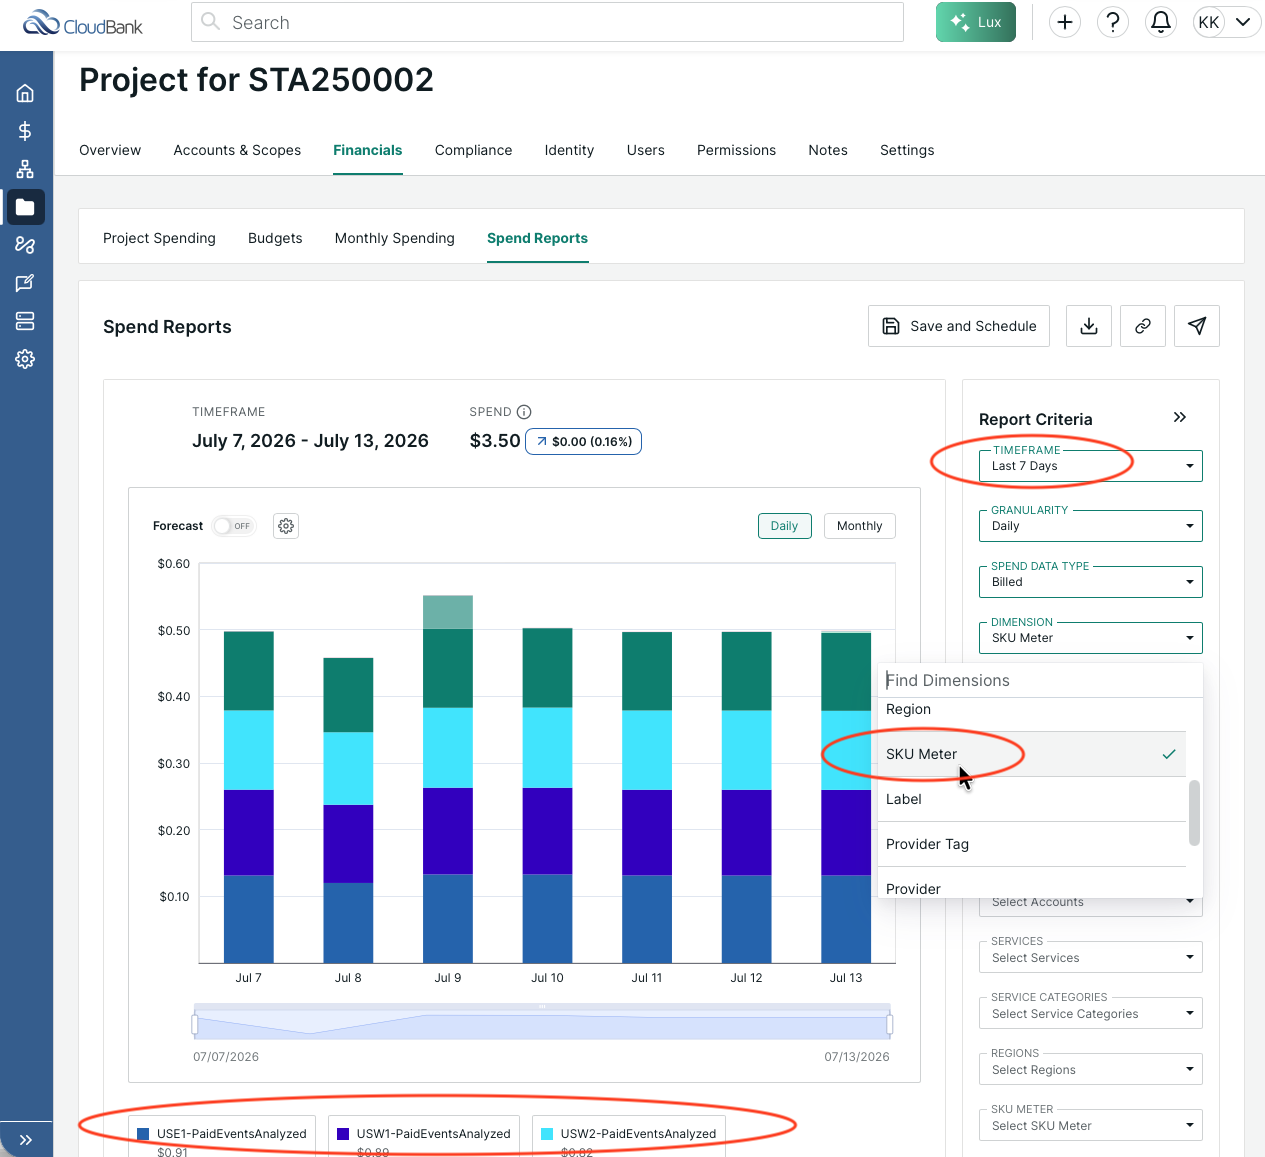
To examine your costs at the most granular level, the SKU Meter dimension goes one level deeper, grouping by the exact billing line items on your invoice (instance-hours by type, storage by class, data transfer). Reduce the date range when using more precise dimensions to return results in a timely manner.
Help
Please email help@cloudbank.org with any cost monitoring questions or issues.